
The actual diversity hasn’t changed much since last year – but that’s hardly surprising as it’s only one year
The number of UK foundations reporting data about the diversity of their staff and boards seems to be growing. These data are from the Foundation Practice Rating which, each year, selects 100 UK grant-making foundations to research, and it publishes a rating of each one. (The method and results are here.) In FPR’s Year Two (2022-23), only nine of the 100 foundations which were researched had disclosed data on the diversity of their staff and/or trustees: in this most recent Year Three (2023-34), that has doubled to 18.
Obviously that is an improvement, but it is also fewer than a fifth of the foundations researched, so there is much more for foundations to do on this.
| Why we publish this The Foundation Practice Rating assesses foundations’ practices in three domains: diversity, accountability and transparency. Its goal is to improve practices, and it is funded by a group of foundations. FPR uses only publicly-available information. In diversity, FPR looks at whether foundations disclose the diversity of their staff and, separately, their trustees, on various dimensions: FPR (currently) does not currently look at what that diversity is. FPR has no opinion on whether any foundation’s diversity is ‘enough’ or what it should be. We simply note what it reports. The research for FPR is conducted by Giving Evidence. Nonetheless, during the FPR research, the FPR team notes which of those 100 foundations make those disclosures. It is only a small step to then log and collate their actual data on what the diversity is, and so – despite this being outside FPR’s scope – Giving Evidence has done this. To our knowledge, these are the sole data about diversity of UK foundations to be published, so Giving Evidence is sharing them here in the hope that they are useful. This is the second year that we have reported these figures, i.e., the first time for which there is any kind of time-series from which to see whether and how the diversity of UK foundations’ teams is changing. Our method FPR draws a fresh sample of foundations each year. Some foundations are included each year (the foundations funding this project plus any which are amongst the UK’s five largest year-to-year) and others are drawn at random. This is so that no foundation is ‘off the hook’: this matters because FPR is a behaviour change project rather than a research exercise. Therefore, some foundations may be included one year but not the next. We report here on the diversity disclosures of the 100 foundations researched in Year Two and the 100 foundations researched in Year Three, although those are not the same set. We have used the same dimensions of diversity in Year Three as we did in Year Two: gender, race, sexual orientation and disability. We have also used the same approach, which is to (a) use the categories which the foundations report and (b) to avoid illegibly-complicated graphs, we report the % of personnel which the foundation reports as identifying as outside the dominant category (e.g., White). This approach is discussed here, and we remain aware of the limitations. |
Foundations in the Year Three cohort (2023-24) which disclose the diversity of their personnel:
| Of trustees: | Of staff: |
| Barrow Cadbury Trust* | |
| Blagrave Trust* | Blagrave Trust* |
| Community Foundation Tyne Wear and Northumberland | Community Foundation Tyne Wear and Northumberland |
| Esmee Fairbairn Foundation* | Esmee Fairbairn Foundation* (senior management team) |
| Football Foundation | |
| Friends Provident Foundation* | Friends Provident Foundation* |
| Indigo Trust* | Indigo Trust* |
| John Ellerman Foundation* | John Ellerman Foundation* |
| Joseph Rowntree Foundation | |
| Joseph Rowntree Reform Trust* | |
| Leeds Community Foundation | Leeds Community Foundation |
| Leprosy Mission International | |
| Lloyds Bank Foundation For England & Wales | |
| London Community Foundation | London Community Foundation |
| Paul Hamlyn Foundation* | Paul Hamlyn Foundation* |
| Power to Change* | |
| Walcot Educational Foundation | Walcot Educational Foundation |
| Wellcome Trust | |
| 11 foundations in total. In Year Two, this was six. | 18 foundations in total. In Year Two, this was five. |
*These foundations are among those which fund the Foundation Practice Rating.
How many foundations report about the various dimensions of diversity?
Increasingly many, on every aspect, though still few given that FPR researches 100 foundations each year.
No. foundations included in FPR reporting on the following aspects of diversity of their teams:
Did any foundations start or cease reporting their diversity?
Yes. If we look at foundations researched in both Year Two and Year Three, we find that:
- One foundation which reported the diversity of its staff in Year Two did not do so in Year Three: that is Garfield Weston Foundation.
- Several foundations started to report the diversity of their teams. For example, Indigo Trust and Friends Provident Foundation both started to report on diversity of both their staff and trustees. John Ellerman Foundation and Blagrave Trust reported only on diversity of their trustees in Year Two but in Year Three were reporting also on diversity of their staff.
How has the reported diversity changed?
Let’s start with the foundations which reported their diversity both in Year Two and Year Three. Their diversity hasn’t changed a whole lot during the year. That’s not surprising: the turnover of foundation staff and trustees is typically pretty low – they’re nice jobs!
Many foundations have fairly few trustees, so even if the reported proportions of their composition had changed, we would need caution because that might reflect only very few trustees joining, leaving, or changing their declarations.
What about the foundations which reported for Year Three but not in Year Two? We need to be mindful that there are two groups of those: first, foundations which were included in Year Two but didn’t report about diversity then though did by Year Three; and also foundations which weren’t included in Year Two. Let’s call the two groups ‘newly-reporting foundations’.
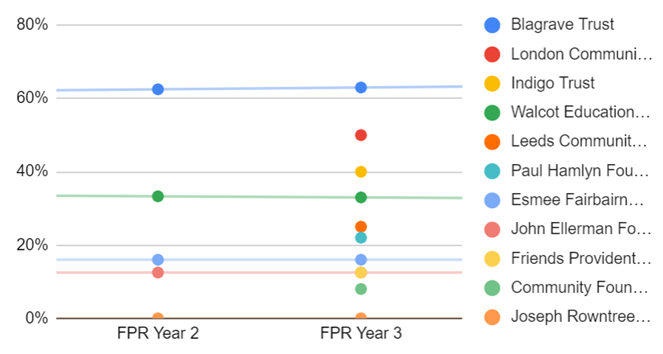
On trustees, no ‘newly-reporting foundation’ reported in Year Three greater diversity than the foundation which reported the greatest diversity in Year Two. For example, on ethnicity, the foundation which in Year Two reported the greatest proportion of trustees who declared themselves something other than White was Blagrave Trust, at 63%. Blagrave Trust’s figure for that was unchanged in Year Three. All the Year Three figures for the ‘newly-reporting foundations’ on that dimension were lower than that for Blagrave Trust:
Trustee diversity, % declaring other than “white” categories:
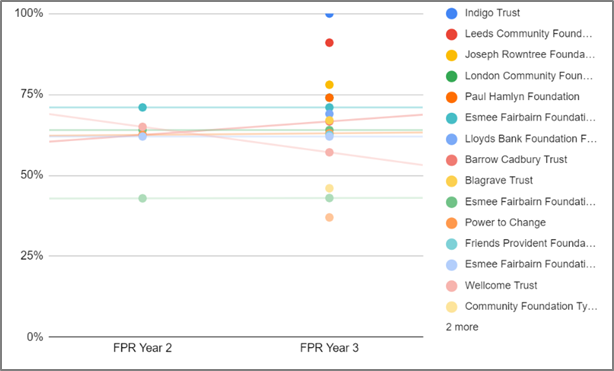
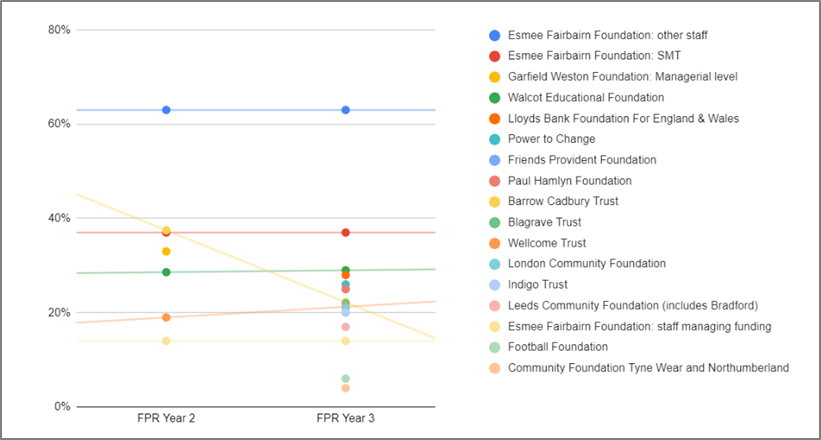
On staff, the story is quite different: some of the ‘newly-reporting foundations’ reported in Year Three greater diversity than the foundation which reported the greatest diversity in Year Two. For example, on ethnicity, the foundation which in Year Two reported the greatest proportion of staff who declared themselves something other than White was Esmee Fairbairn Foundation, at 23%. Again, its figure for that was unchanged in Year Three. But in Year Three, Friends Provident started reporting on this, and reported 38% (see graph below). Similarly, on staff gender, the foundation which in Year Two reported the greatest proportion of staff who declared themselves something other than male was again Esmee Fairbairn Foundation, at 71%, which was again unchanged in Year Three. But in Year Three, Indigo Trust started reporting on this, and reported 100%. Three other ‘newly-reporting foundations’ also reported figures higher than 71%.
Staff diversity, % declaring other than “male” categories:
There also examples of the converse: where newly-reporting foundations report in Year Three having fewer staff outside the dominant category than did the lowest-reported foundation did in Year Two. Staff ethnicity is an example:
Staff diversity, % declaring other than “White” categories:
These numbers don’t indicate whether diversity of either trustees or staff have changed, because we don’t have the data for these foundations for Year Two. Rather, they simply indicate that more foundations are reporting, and that some of the foundations new to doing so have more staff outside the dominant categorisation than do the foundations which reported in Year Two. Giving Evidence will continue to track these data and assess the changes over time.
The levels of diversity reported
Within the foundations which report diversity on these dimensions, there is a range of levels of diversity.
- The largest range is for: staff gender, and trustee ethnicity. In both cases, the difference between the highest proportion and lowest is 63 percentage points.
- The smallest range is for: trustee sexual orientation, where the difference between the highest proportion and lowest is 22 percentage points.
Range of proportions of personnel who declare identifying as:
| Trustees | Staff | |
| Ethnicity: % declaring other than “White” categories | 0 – 63% | 4 – 63% |
| Disability: % declaring disability (sometimes including limiting health conditions) | 0 – 50% | 0 – 38% |
| Sexual orientation: % declaring orientation other than straight | 0 – 22% | 8 – 44% |
| Gender: % declaring other than “male” | 40 – 67% | 37 – 100% |
Some key findings
- For three of the four categories measured – ethnicity, disability and sexual orientation – some foundations reported having no trustees who identify outside the dominant category.
- On disability, 17% of the UK population is disabled (Census, 2023). Only four foundations reported that, of their staff, more than that proportion identify as having a disability, whereas eight reported fewer. The picture for trustees was more balanced: six reported a proportion lower than 17% whereas four reported having more.
Giving Evidence will continue to monitor and report about the amount of disclosure by foundations, and the level of diversity reported.
________

