Below is the video and the references. Caroline’s speaking notes are here. The slides are here.
Below is Caroline’s talk. Ghana had played England in the men’s football World Cup the night before – their first competitive match ever! – which was a draw: hence the discussion about that at the beginning. Note that after Caroline starts talking there seems to be an echo: that wasn’t in the room at the time, and stops after a couple of minutes.
References:
Banerjee, A.V. & Duflo, E. (2011). Poor Economics: A Radical Rethinking of the Way to Fight Global Poverty. London: Penguin Books.
Flexner, A. (1939). “The Usefulness of Useless Knowledge.” Harper’s Magazine, 179.
Chapman, S. (2015). “Reflections on a 38-year career in public health advocacy.” Public Health Research & Practice, 25(2).
Hardwick, R., Anderson, R. & Cooper, C. (2015). “How do third sector organisations use research and other knowledge?” Implementation Science, 10:84. (Note: studies health and social care non-profits specifically.)
Oliver, K. & Cairney, P. (2019). “The dos and don’ts of influencing policy: a systematic review.” Palgrave Communications, 5:21.
Manning, R., Goldman, I. & Hernández Licona, G. (2023). “Impact evaluation and synthesis — how far are they being used in low- and middle-income countries?” Journal of Development Effectiveness, 15(2), 148–164.
Kahneman, D. & Tversky, A. (1974). “Judgment under Uncertainty: Heuristics and Biases.” Science, 185(4157), 1124–1131.
Fiennes, C., Mendizabal, E., Morales, M. & Datta, A. (2021). “Evidence-into-Policy Partnerships: Insights and Patterns.” Giving Evidence / OTT Consulting. (Primary research: interviews with IPA, J-PAL, ID Insight, Evidence Action, Busara, CGIAR, and others.)
Fiennes, C., Mendizabal, E., Morales, M. & Datta, A. (2021). “Evidence-into-Policy: Useful Insights from the Literature.” Giving Evidence / OTT Consulting.
Conservation Evidence is a splendid initiative of U.Cambridge which collates the existing evidence on species conservation, to make it easier for funders, practitioners & policy-makers to find and use.
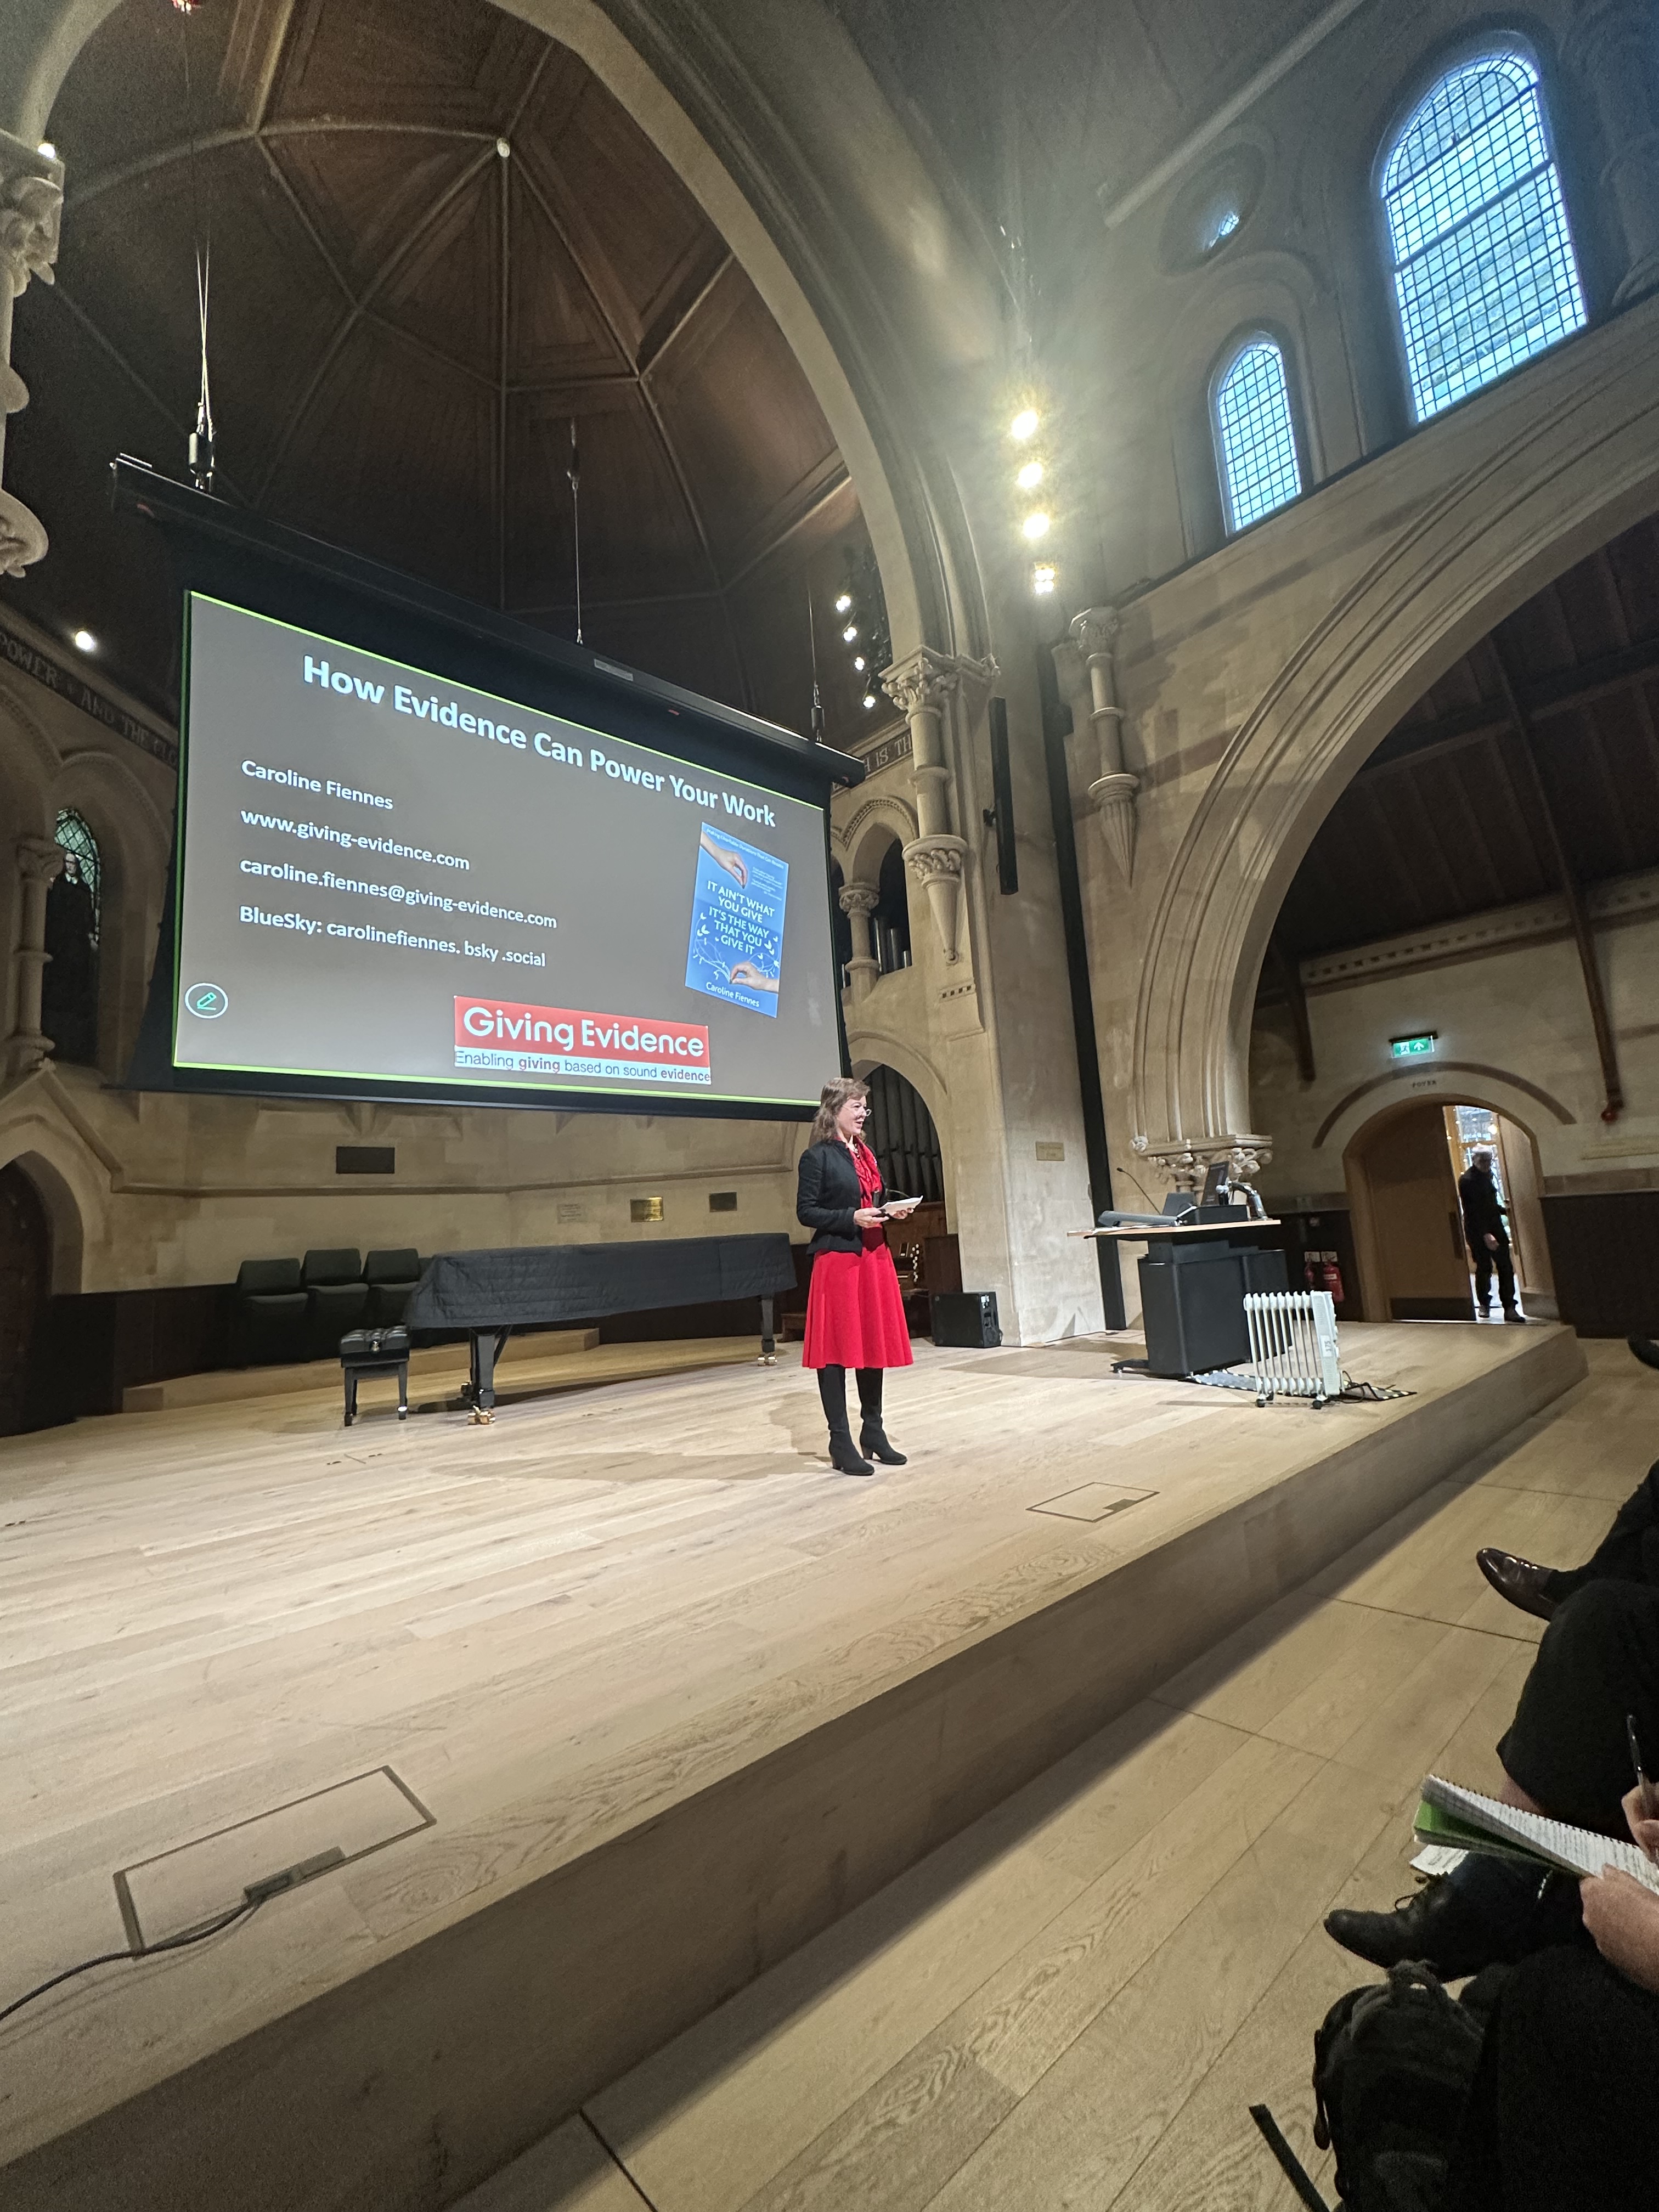
Caroline gave this talk (video here) at its conference in January 2026. She spoke about the cycle of a project / programme, what information / evidence is needed at each stage, and specifically about how impact evaluations are only needed in specific circumstances (in which, they are very much needed).
{The conf was in a re-purposed church! Very exciting. Notice the giant apse!! (curved East end where the altar would have been.)
The venue clearly isn’t expecting speakers to stand in the middle of the stage, so the camera only shows the AV table to the side. Caroline herself briefly appears in the video at ~9.11 and 10.21 – to check the time because no clock was visible from the stage!
The zoology professor who runs Conservation Evidence had previously told Caroline that creatures which are red & black are less likely to be eaten. One can never be too careful…}
The references are as follows:
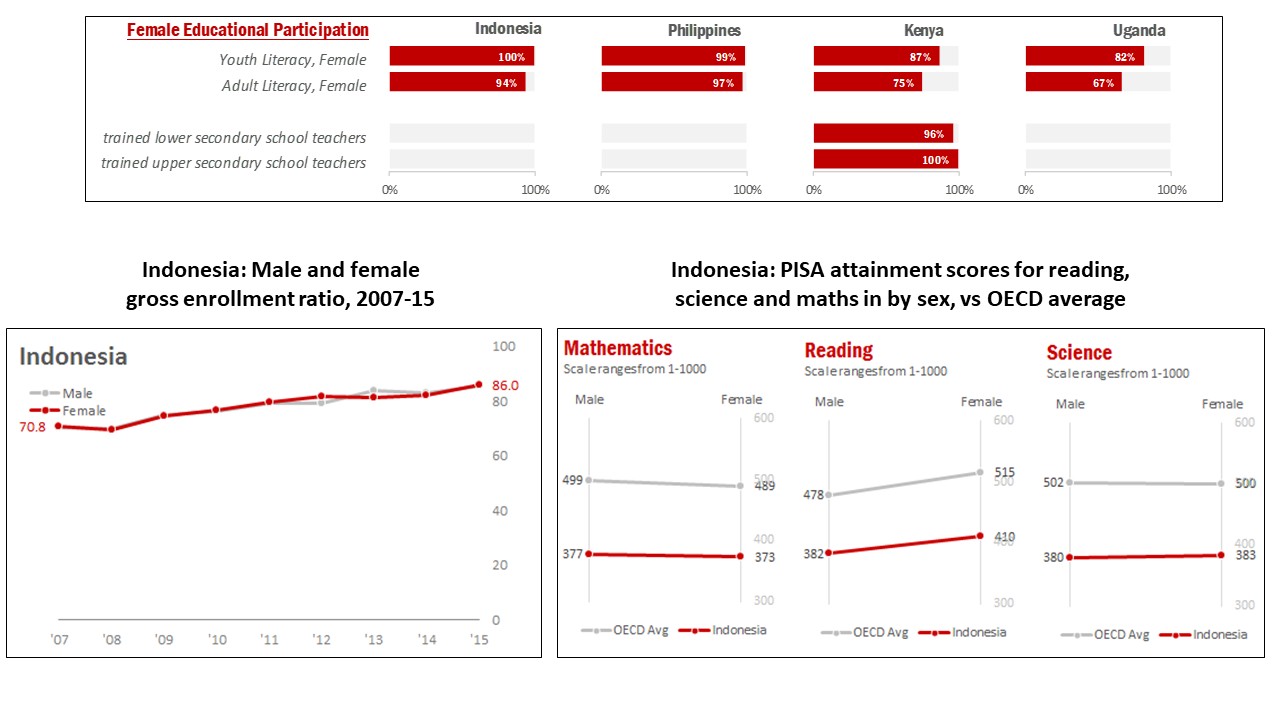
The Indonesia education example (how girls & boys participation & attainment were about equal but both miles below the OECD average): these are from PISA data:
Northern Bangladesh & the hungry season: see here. (Also, for completeness, here.)
Offering incentives to parents to get their children vaccinated: see here and many other papers e.g., here.
The large-scale education intervention in Madhya Pradesh, India, where the implementation broke down: see here. (The ARK paper was still in draft at that time but may be public by now. This is the protocol, I think.)
Evidence & gap map about institutional responses to child abuse, as produced by Giving Evidence. As mentioned, many of the studies are in one cell – the effect of ‘good touches vs. bad touches’ programmes in schools on children’s understanding – and they all find that those programme work. See here.
The UK Ministry of Justice Data Lab evaluations: that the sample size (no. participants) in most of the charity programmes that it had tried to evaluate was too small for results to be statistically significant: see here.
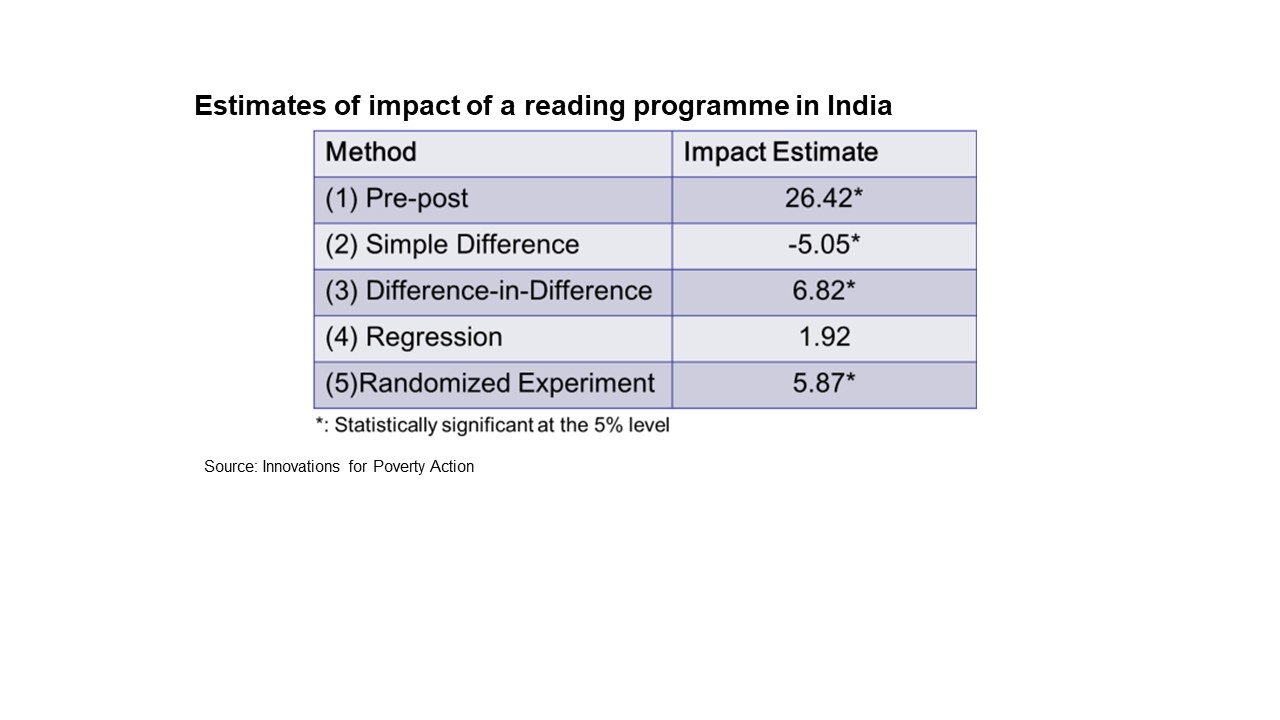
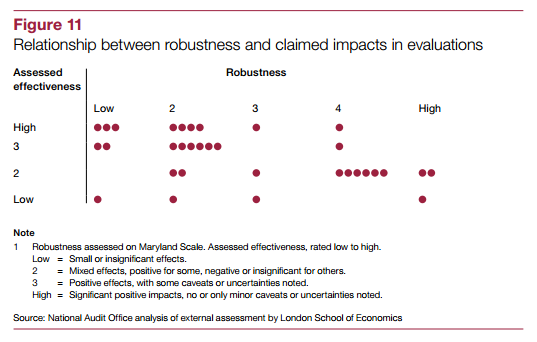
The research method matters! Different methods can give different answers even for the effect of the same programme. See the data below about a reading programme in India. Also, the UK’s National Audit Office looked at many UK gov’t evaluations, and plotted them on the rigor of the method vs. the level of effectiveness that they found. Notice that a line of best fit goes top left to bottom right: the more rigorous methods find smaller effects:
By the way, the conference was at Pembroke College Cambridge: it bought the church over the road & re-purposed it. As it happens, Pembroke’s own chapel is by Christopher Wren. His first building! See below: not bad for a beginner.
An amazing feature of that chapel is how fully-formed Wren’s style is already. It could also pass as his last building. The symmetry, proportions, Classical-ness, clever use of light & dark & perspective, columns to separate spaces, characteristic ornamentation… it’s all there, in Building No. 1.
And who commissioned this mathematician / astronomer with no architecture experience to design this building but…his uncle! Then Master of Pembroke. Wren was a nepo-baby! (He totally wasn’t. He was a Fellow of All Souls’ Oxford at age 23 🫣 But we may all be indebted to Uncle Matthew Wren!)
(You can’t see from these photos, but when I visited the chapel before the conference, the Bible happened to be open at Psalm 23… 🤩 Excellently calming.)
Giving Evidence today publishes new research showing that Prince Andrew’s patronage of UK charities had no discernible effect. This is reported in The Times here. Thread about that here. Prince William was reported as taking a “forensic interest” in this research(!)
This follows research that we published in 2020 which looked at the charity patronages of seven senior working Royals, which also found no discernible effect on the charities’ revenue. (Twitter thread about this.) That previous research looked at when patronages started; this recent research looks at when they ended, i.e., uses a different data-set to investigate the same question.
In other words, charities may be wasting their time in seeking, securing and servicing a Royal patron. (We realise that some charities don’t choose to have a Royal patron, e.g., the Royal Society always has the monarch as patron & has done since its founding in the C17th.)
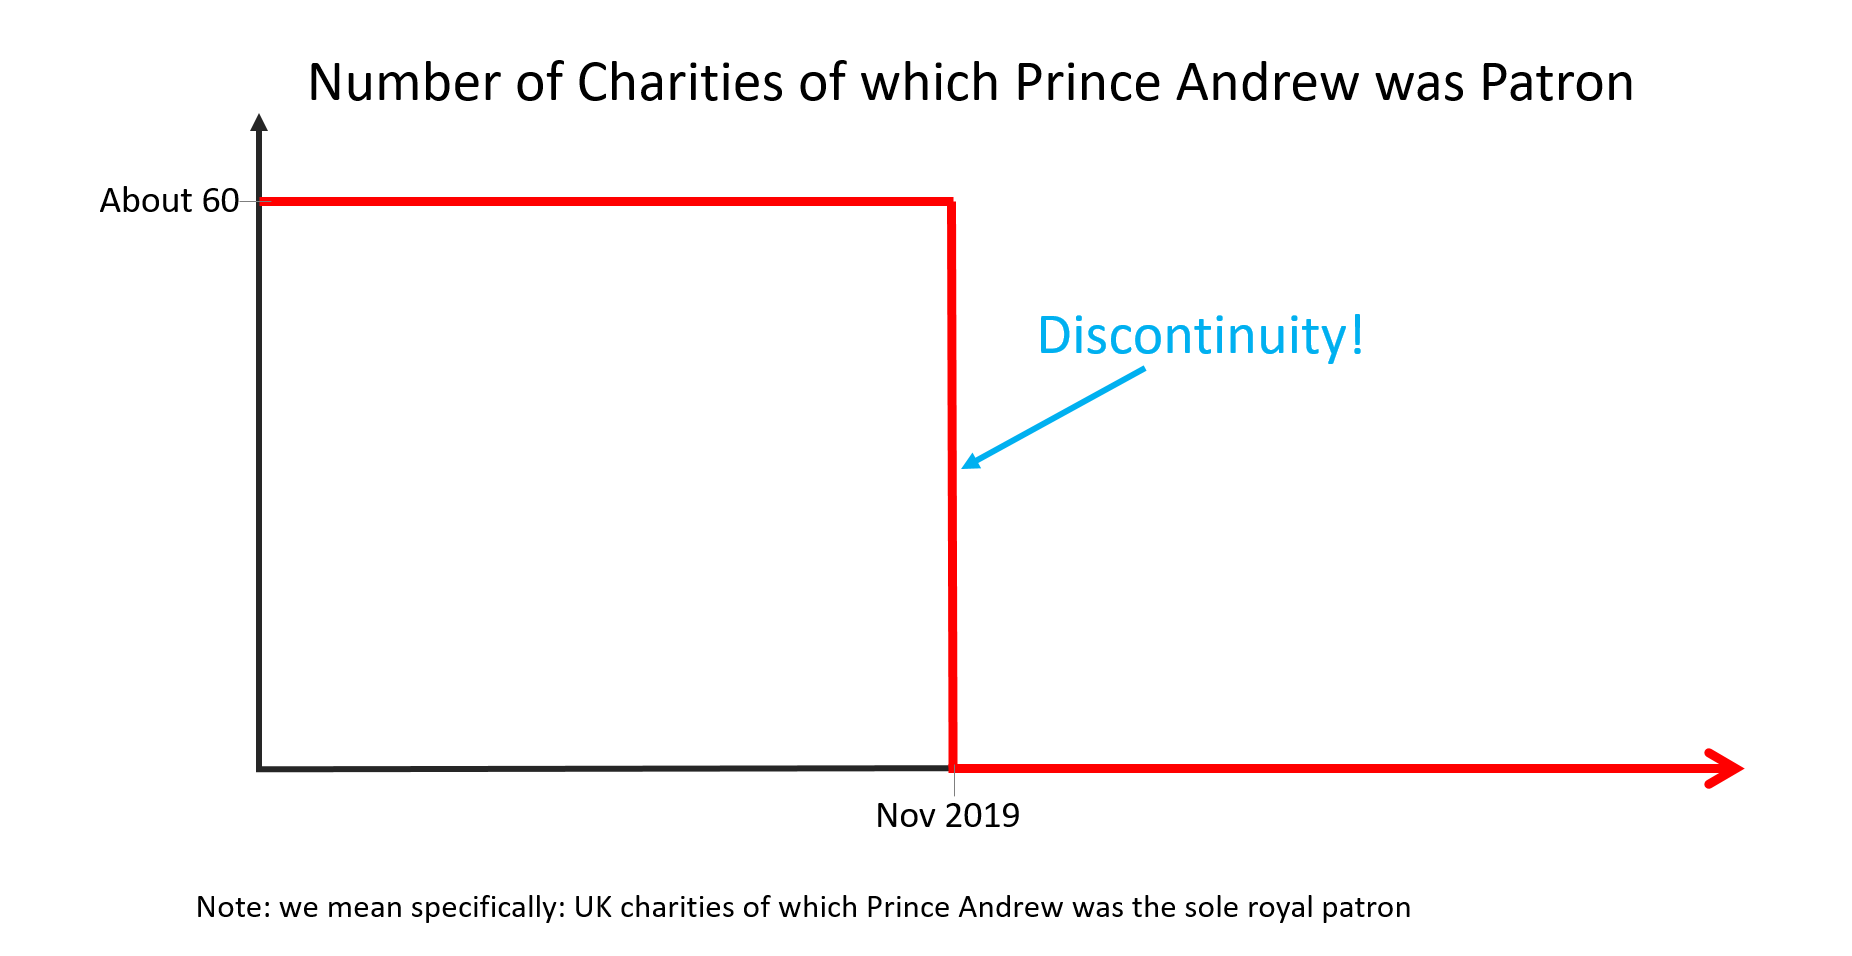
When Prince Andrew “stepped back” from all public duties after his Newsnight interview in November 2019, all his patronages ended suddenly and simultaneously. That ‘discontinuity’ is a “natural experiment” which Giving Evidence has used to see the effect of his charity patronages.
We used complex statistical analyses, to see whether anything happened to the revenue of Prince Andrew’s patronee charities before and after the patronage ended which did not also happen to all other charities. (Those latter serve as a control group.)
It didn’t.
We ran six linear regression difference-in-differences analyses, none of which could detect any effect of Prince Andrew’s patronage on the charities’ revenue.
The findings
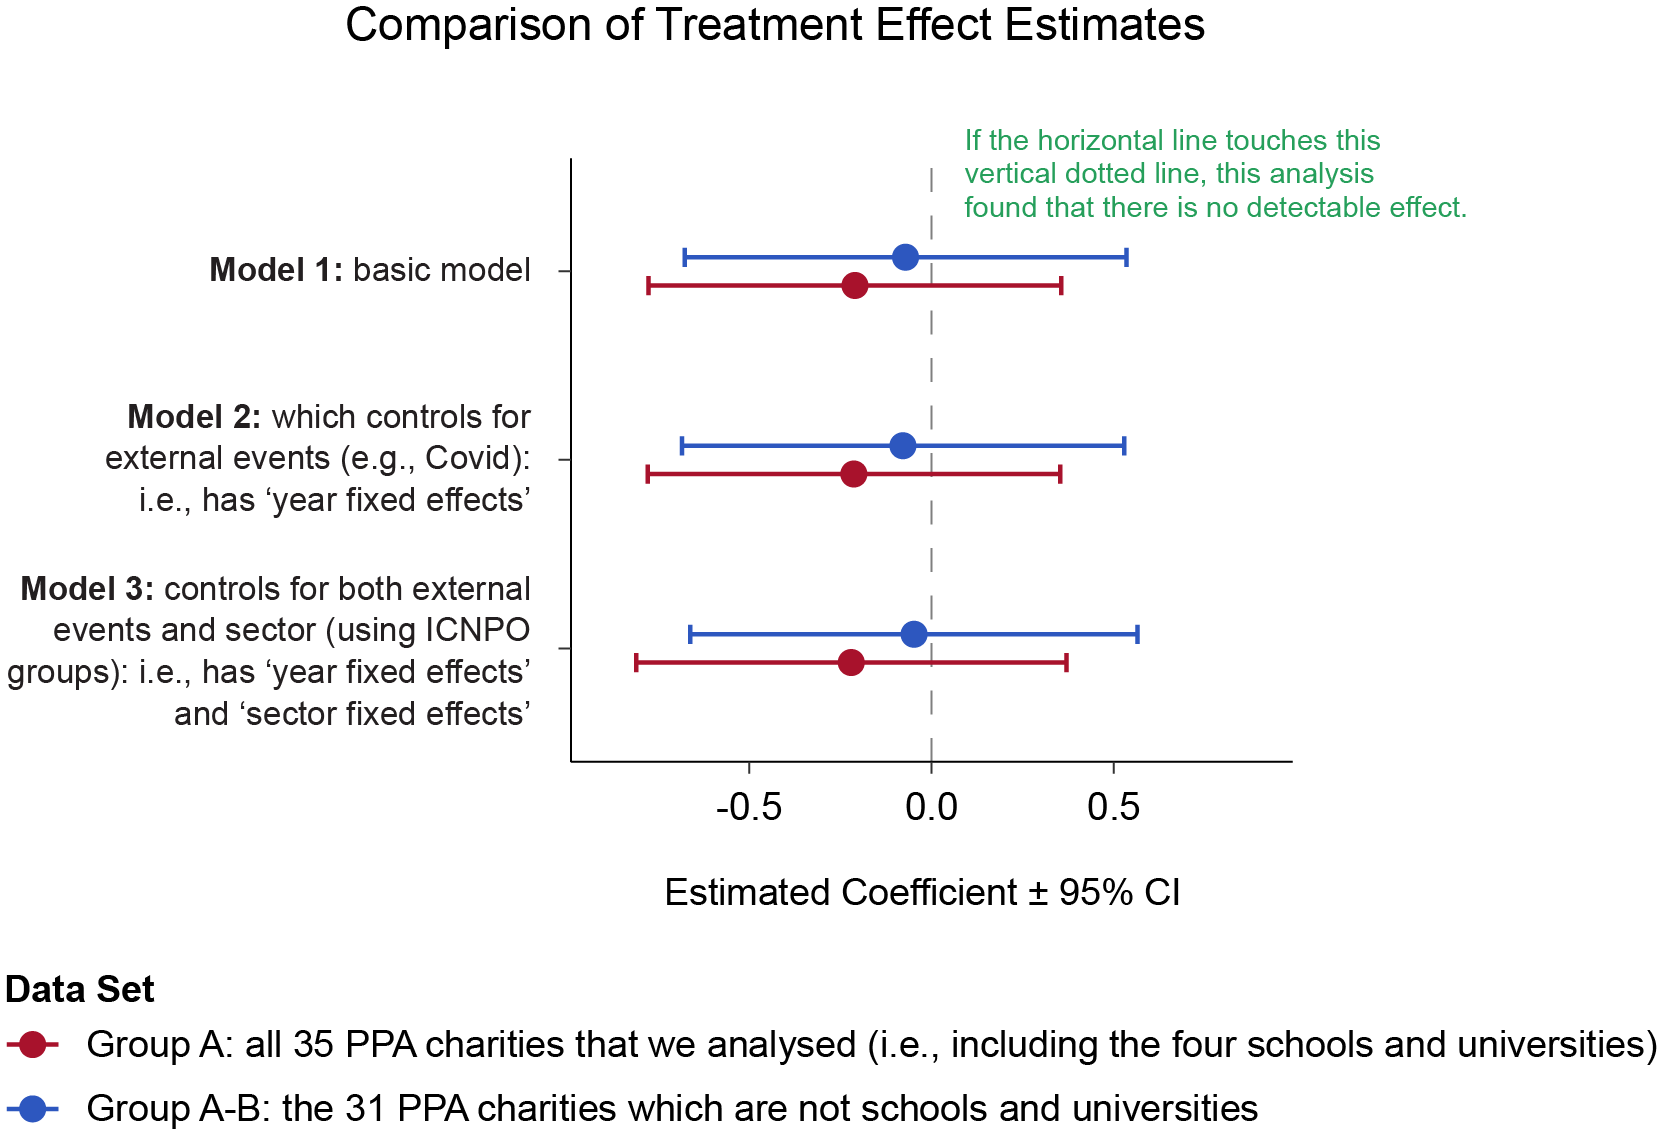
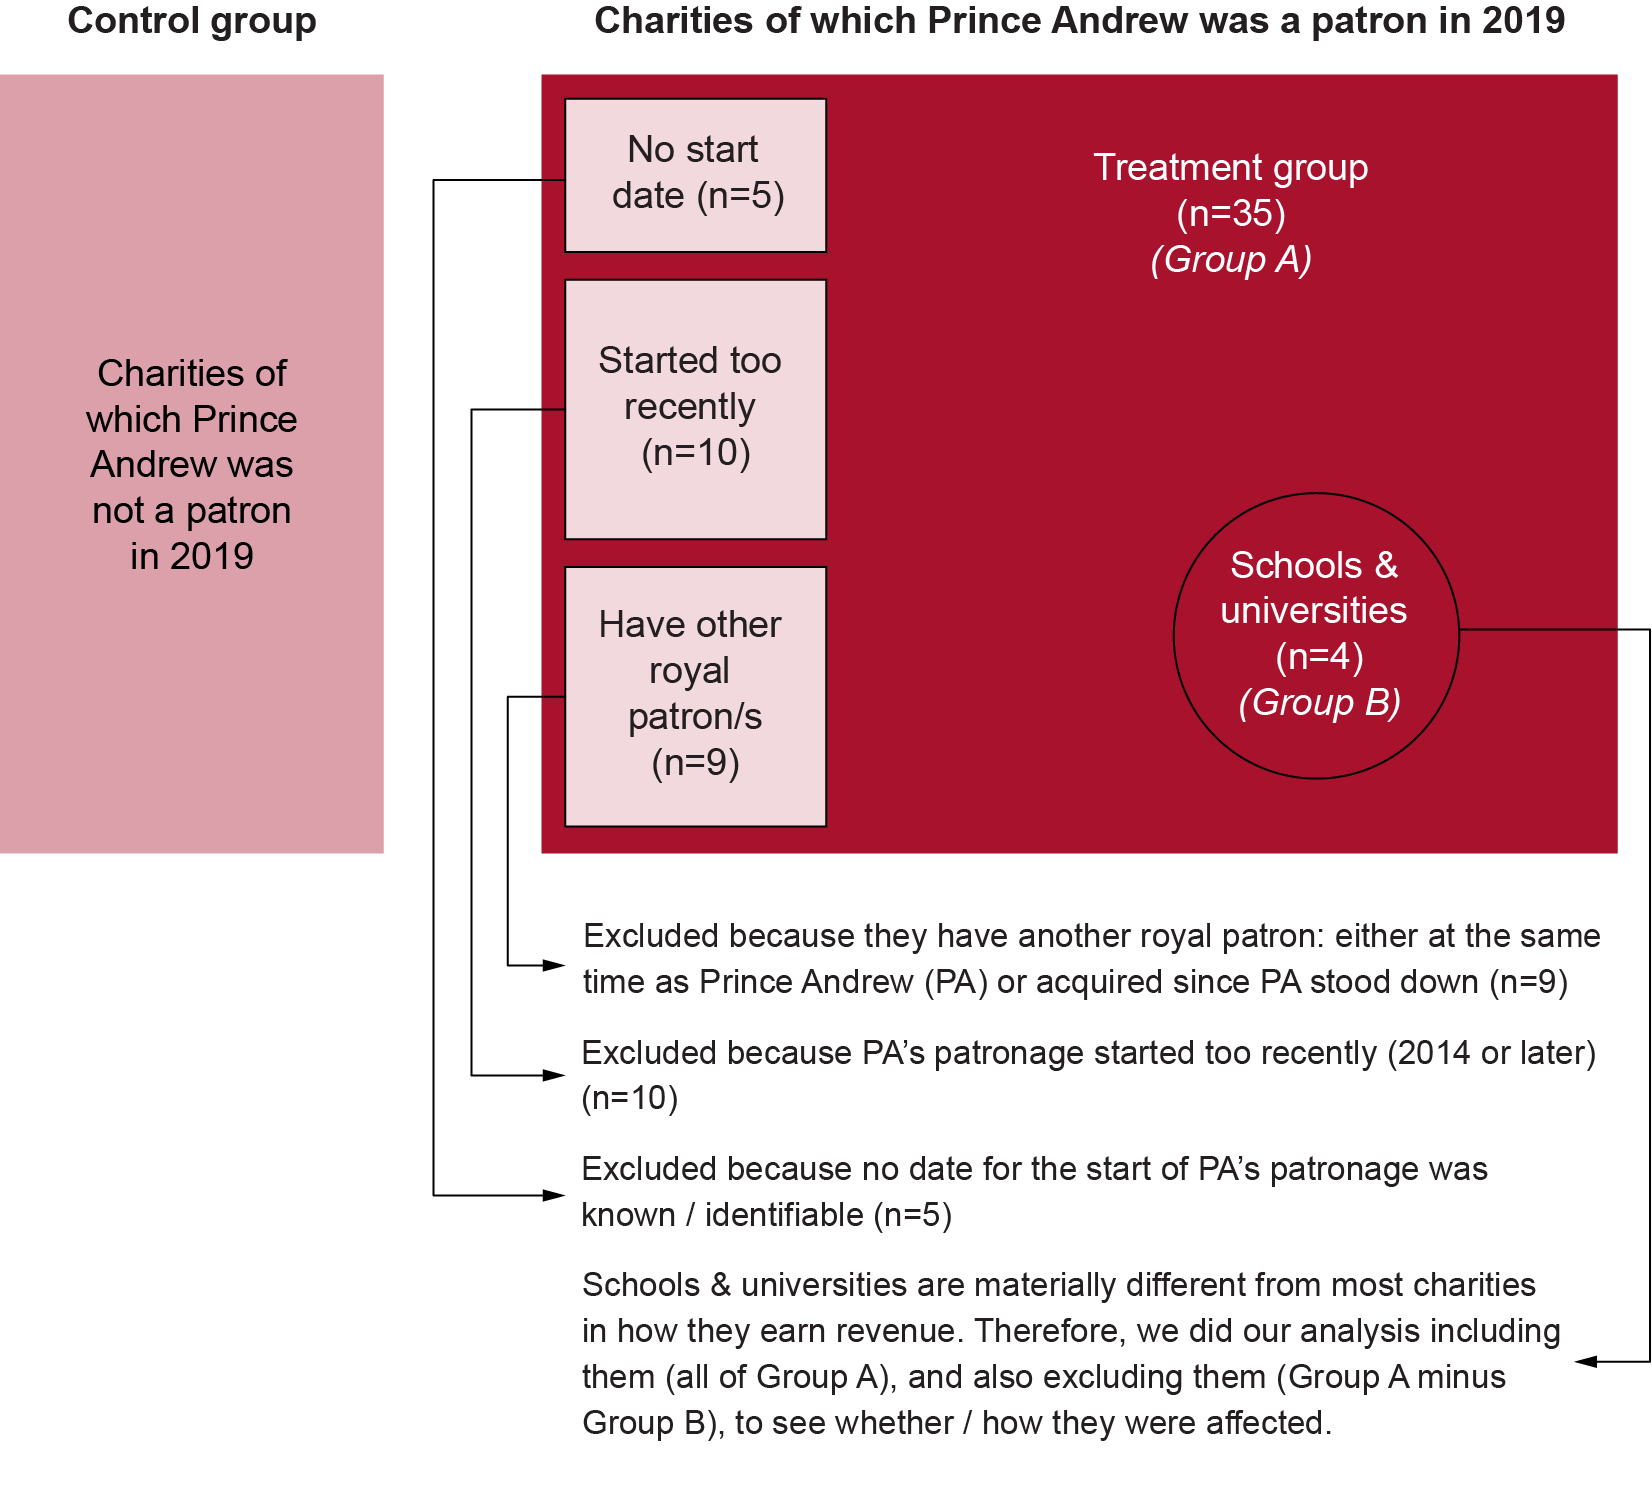
Here are the results. Our six analyses are: three models, which variously account for differences over time and between sector (health, education, etc.); and we ran each one twice, for Prince Andrew’s patronee charities including vs. excluding the schools and universities which obviously raise funds differently to most charities.
In the graph, the horizontal lines show the range of possible effects of Prince Andrew’s patronage (to 95% certainty), indicated by each analysis. Lines that cross the vertical dotted line find no statistically significant effect.
They all do. Hence our conclusion that Prince Andrew’s patronage had no detectable effect on the charities’ revenue.
That result is sort-of visible to the naked eye: The graph below shows income (on a log scale, because charities’ revenue bounces around a lot so is a bit illegible) of Prince Andrew’s patronee charities (PPAs; in red) vs. all other charities in England and Wales (in grey). [Actually, here, we have removed the smallest ones & the largest ones: this is the inter-quartile range of both sets.] First – and this doesn’t matter – it’s clear that charities of which Prince Andrew was patron are much larger than most: over eight times larger. In 2020, we found that charities patronised by any of the seven senior Royals are ~30x larger than average.
More important is that when Prince Andrew stepped back in late 2019, nothing different seems to happen to the revenue of PPAs than to revenue of non-PPAs. If his patronage had really helped charities’ revenue, we’d expect to see some difference.
Full detail of Giving Evidence’s analysis is in the report, and the data and code are here. The research is also deposited in the Oxford (University) Research Archive, at the Bodleian Library, here.
[There are occasionally stories of the Royals creating costs for charities. The Telegraph reported that a charity had paid to fly Prince Andrew to New York for a fundraising event in 2001.]
How is this different to Giving Evidence’s previous research on the effect of Royal patrons?
This addresses the same question – ‘do they help? / how do they affect revenue?’ – but using a different dataset, and a dataset which is only newly available. The previous research, published in 2020, looked at changes to charities’ revenue when a patronage started; whereas this new research looked at changes to charities’ revenue when patronages ended. Both analyses use as comparators other charities (including the full set of all charities in the country).
Of what was Prince Andrew patron?
Good question. When we started our work in 2019, the Palace published a list of which Royal(s) were patron of what. It was incomplete, with inaccuracies, omissions & duplications. So Giving Evidence had to assemble that list ourselves. That took fully six person-weeks(!)
Now, under King Charles, the Palace publishes no such list at all. So Giving Evidence’s list of who is (or was) patron of what places us uniquely to do this work.
Anyway, Prince Andrew appears to have been patron of 59 UK-registered charities, plus dozens of non-charitable entities such as golf clubs, polo clubs and parts of the military. Our analysis included 35 patronee charities: some had to be excluded because the patronage had started too recently, and so on.
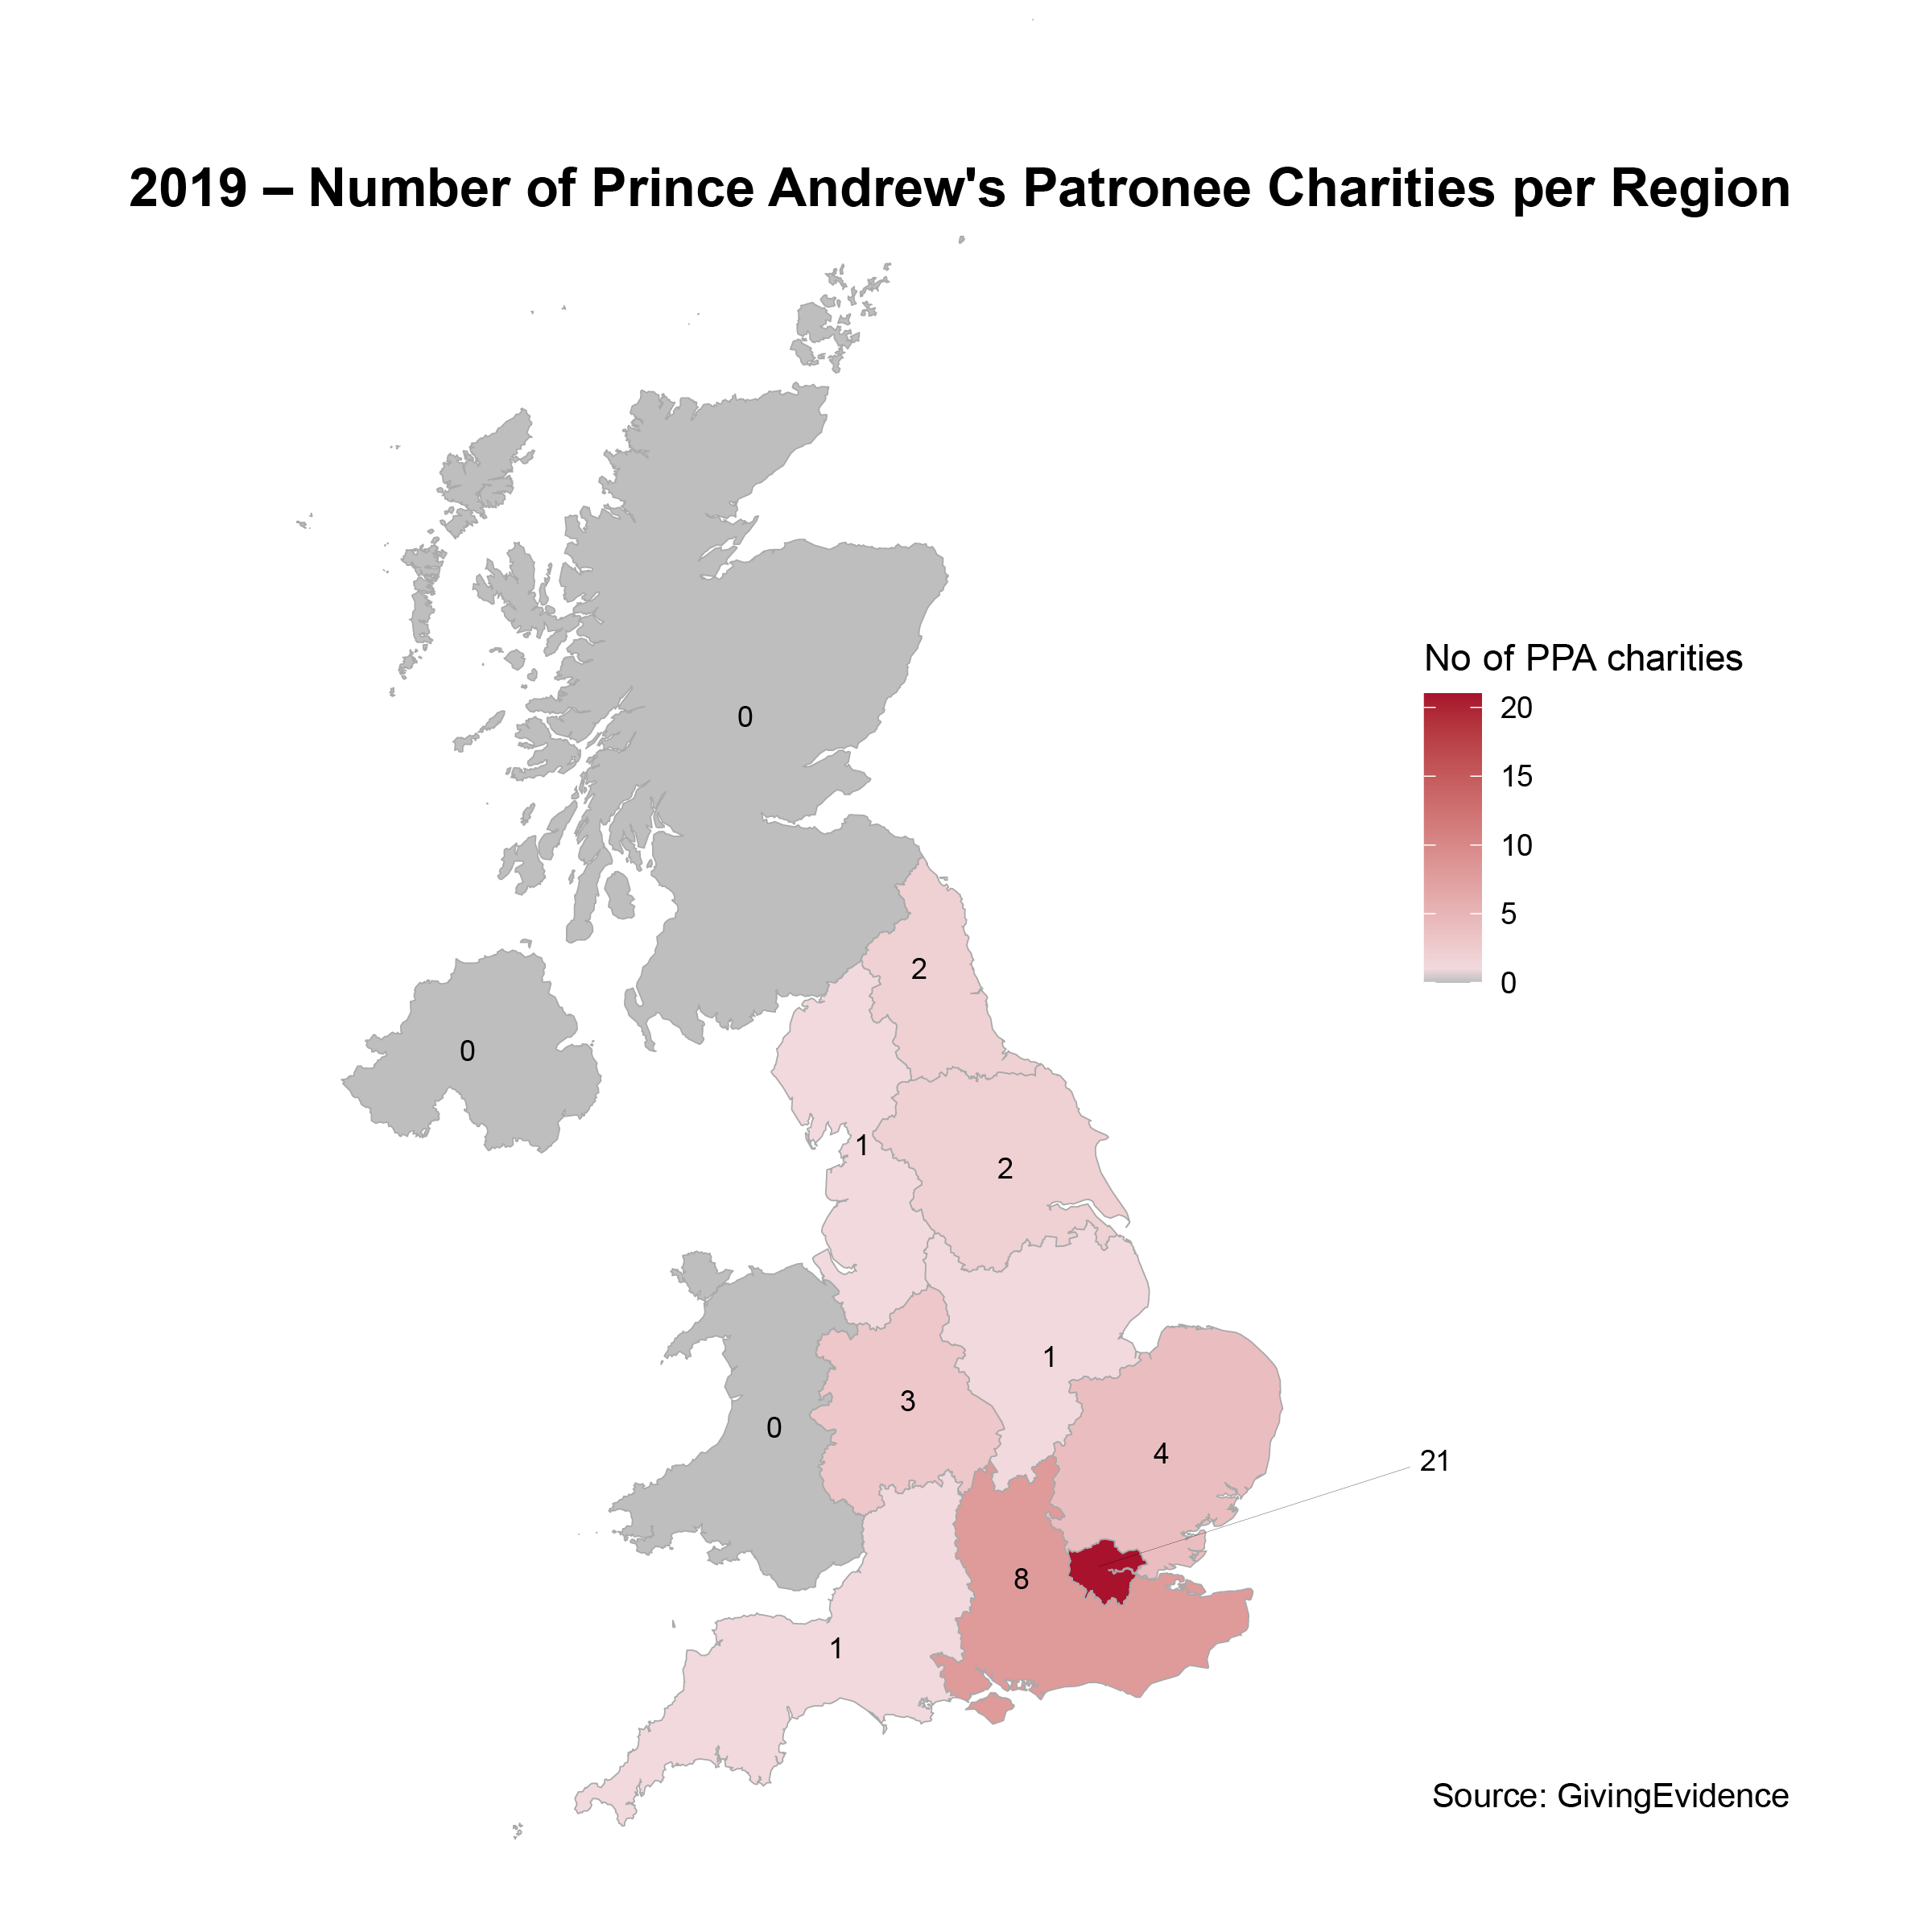
Oddly, given that Prince Andrew is Duke of York, only four were in Yorkshire, and none at all were in Wales, Northern Ireland or Scotland. Those regions are all also ‘under-patroned’ by the seven senior Royals (discussed in our research published in 2020).
Why does a Royal patronage not help revenue?
Possibly because they don’t comprise much. In 2020, we analysed the Court Circular (official Palace record of Royals’ activities) for 2019. Three-quarters (74%) of UK charities with Royal patrons did not get a single official engagement with them that year. In 2020, Kate Middleton only had nine patronee charities, yet it transpired that one of them hadn’t seen her for eight years – eight of the nine years since she became a Royal.
Most of the charities who got multiple official Royal engagements were founded by the Royals, e.g. The Prince’s Trust.
What about effects other than on revenue?
For our previous analysis, we explored analyzing the effect of Royal patronages on other outcome variables, such as charities’ reputations, staff morale, press mentions as well as revenue. In the end, revenue turned out to be the only one which was workable: the others are not reported publicly or measured in any consistent way – so there is no data-set to analyse – and/or the definitions are not clear (for example, with press mentions, one would need sentiment analysis to identify whether any mention was positive or negative, which was beyond the project’s resources).
By contrast, charities’ revenue is reported in a consistent way and to a regulator, i.e., the reported figures are likely to be correct.
_____________
We hope that our research enables more evidence-based decisions by patrons, donors and charities, and hence more effective work for their intended beneficiaries.
__________
Background notes:
Giving Evidence’s research into Prince Andrew’s charity patronages was funded by The Human Rights Fund. It drew on Giving Evidence’s research published in 2020 which was funded by the Belgian Red Cross, Flanders, which has a demonstrated commitment to producing high-quality evidence to inform decisions of operational entities, in the Red Cross network and beyond. [Giving Evidence’s Director Caroline Fiennes is ona board of the Belgian Red Cross, Flanders.]
Giving Evidence works to increase the effectiveness of charitable resources, by enabling decisions based on sound evidence. Giving Evidence takes no position on the Royal Family.
Prince Andrew is the second son of the late Queen Elizabeth II: so, until the birth of Prince Charles’ first child (Prince William), Prince Andrew was second in line to the British throne. He is the Duke of York and often referred to by that title.
Contact: about this research: caroline.fiennes@giving-evidence.com, +44 7803 954512
Do UK royal patrons help charities? Giving Evidence looked at this question in 2019/2020 and could find no evidence that they do – at least, not that they help to raise revenue. In other words, charities may be wasting their time in seeking, securing and servicing a royal patron. (We realise that some charities don’t choose to have a royal patron, e.g., the Royal Society always has the monarch as patron & has done since its founding in the C17th.)
Giving Evidence is now investigating this question in a different way, taking advantage of an unprecedented opportunity, and our unique dataset.
Prince Andrew “stepped back” from all public duties after his Newsnight interview in November 2019. That meant that all of his ~60 charity patronages ended at once (see graph). That creates an opportunity for analysis: in the language of statistics, that ending is a ‘discontinuity’ experienced by multiple entities simultaneously. We plan to analyse that discontinuity to find the effect of Prince Andrew’s patronages ending, and thereby what the effect of his patronages was.
In other words, now is the first point that enough ‘after’ data are available for this analysis to be possible.
Giving Evidence is unusually well-placed for this work, because we have the list of charities of which Prince Andrew was patron. Before the late Queen died (in September 2022), the British royal family’s website, royal.uk, listed all royal patronages. Its data were incomplete and inaccurate but at least it existed. After the late Queen died, that list disappeared and is no longer available. But Giving Evidence has the list from our 2020 analysis.
Giving Evidence will look at Prince Andrew’s effect on charities’ revenues. For the previous analysis, we explored analyzing the effect of patronages on various outcome variables, such as charities’ reputations, staff morale, press mentions as well as revenue. In the end, revenue turned out to be the only one which was workable: the others are not reported publicly or measured in any consistent way – so there is no data-set to analyse – and/or the definitions are not clear (for example, with press mentions, one would need sentiment analysis to identify whether any mention was positive or negative, which was beyond the project’s resources). Charities’ revenue is a great outcome because it is reported in a consistent way and to a regulator, i.e., the reported figures are likely to be correct. The analysis will look at all UK charities: it compares the changes in revenue of Prince Andrew’s patronee charities before vs. after the patronages ended, with the changes in revenue of all other charities at that time. This ‘difference-in-difference’ method is a standard way of assessing the effects of ‘interventions’ which cannot be randomised. (In effect, the patronage is/was an intervention in the life of a charity, and we are trying to identify its effectiveness.)
Our previous analysis looked at the discontinuity when patronages started; this new analysis will look at the discontinuity when patronages ended. [Technical note: though we use the term ‘discontinuity’, because there is one, we may not use regression discontinuity design, but instead difference-in-difference and other methods.]
If you are a Royal or celebrity patron and would like to be involved, do get in touch. Equally, if you are a charity with a Royal or celebrity patron and would like to be involved, do get in touch.
We are grateful to the Human Rights Fund for enabling this project.
__________
Background notes:
Prince Andrew is the second son of the late Queen Elizabeth II: so, until the birth of Prince Charles’ first child (Prince William), Prince Andrew was second in line to the British throne. He is the Duke of York and often referred to by that title.
Prince Andrew was patron of ~60 charities. (And also many other entities which are not charities, such as parts of the military – which we will not analyse.) Our analysis looks only at (patronages of) UK charities – because their accounts are reported to the same regulators; we also only look at charities where Prince Andrew was the sole royal patron – to avoid the confounding factor of other royal patrons.
Because our analysis will cover the period since Prince Andrew’s patronages ended (i.e., since November 2019), it includes the deaths of Prince Philip and the late Queen – in 2021 and 2022 respectively – and also Covid.
Our research refers to Members of the Royal Family (MRFs) by their actual name, e.g., Prince William. This is not out of disrespect but rather simply to be easier for the reader. First, people (especially non-UK readers) may not know who the Earl of Wessex is; and second, various MRFs changed title after Prince Philip and the late Queen died, so using their titles would be confusing. For instance, during the period which we will be discussing, “the Prince of Wales” has meant both Prince (now King) Charles and Prince William.
Also since the late Queen died, the royals have done / are doing a ‘review’ of all their patronages: some have been re-allocated to other MRFs. The royal family no longer publishes a list of who is patron of what(!) so it is not possible to get from them a definitive list of which of Prince Andrew’s charity patronages have been re-allocated. Giving Evidence has had to research those individually.
Giving Evidence recently completed a systematic review of what is known (the literature) about women on remand in the UK. We found more than expected, though very little about ‘what works’.
We produced: an ‘Evidence and Gap Map’ which shows what the literature covers and where there are gaps (lovely interactive version*); and a synthesis of what all the literature says (full paper here: appendices below).
Systematic reviews and syntheses like this are *really useful* for funders, practitioners, policy-makers and others because they save you having to find and read over a hundred documents! – some of which are entire books or PhD theses. (Believe me: we did you a big favour there!) They summarise what is known, so they help to make evidence-informed decisions quickly.
Why we did this
Putting innocent people in prison is a travesty. And yet, in the UK many people who have been arrested are locked up “on remand” before their trial – they may turn out to be innocent, or go on to receive a non-custodial sentence. Their time on remand disrupts their lives – raising children, other family responsibilities, ability to retain their job and hence housing – as well as harming mental health. A quarter of all women in prison in England and Wales are on remand, and it may be unnecessary: around two thirds of women on remand are eventually acquitted or get community sentences.
This all happens while UK prisons are full: the prison population in England and Wales has doubled over the last 30 years despite crime rates falling substantially. The prisons crisis is a Government priority, and hence its current review of sentencing.
In short: more than we were expecting. We included documents from the last 10 years, and found 109 relevant documents 🙂 But:
Only two documents explicitly focus on women on remand. Most have broader focus e.g., remand all prisoners, all prisoners, everything in all prisons, everything in some specific prisons etc.
Zero robust evaluations: there are seven studies which relate somewhat to the effectiveness of an intervention, but none is a true impact evaluation: rather, they are descriptions of interventions, or use participant-reported effects, author’s interpretations, etc.
Only two documents relate to cost analyses.
So the literature reveals much about what is happening, but far less about why it is happening, what is effective, or how to implement meaningful change.
The importance of intersections of factors that lead women into remand is highlighted, including systemic inequalities, gender-specific criminogenic needs, and inadequate support mechanisms. Yet very few studies explore how overlapping identities (such as ethnicity, class, age, gender, LGBTQ identity, disability, nationality or immigration status) shape women’s experiences and outcomes.
The literature focuses on the justice system, with much less attention given to the roles of health, welfare, and housing services.
There is very little material about why remand is used e.g., why judges / magistrates use it: this is discussed in only two documents. (However, there is some material about factors that seem to increase the chance of being remanded, e.g., having complex needs.)
So there are important gaps around: understanding how overlapping forms of disadvantage or discrimination affect women’s pathways through the criminal justice system; investigation of why women are remanded; and rigorous evaluations to understand what interventions are effective for women on remand in the UK.
Our synthesis found that justice system frequently remands into custody (i.e., imprisons) women who do not eventually get convicted (20% are not convicted), and fails to support them properly.
Frequent, disruptive, and often unjustified use of remand
Women are routinely held on remand for relatively short periods – on average for 37 days – which is long enough to “disrupt families, housing, and finances…Even short periods of custody can result in a mother losing her home or her children being taken into care.”
Women on remand have high and unmet mental health needs
Women on remand frequently experience can have mental health issues but are excluded from appropriate care: they may be specifically ineligible for in-prison mental health services or therapeutic interventions. Unsurprisingly, high levels of anxiety, depression, and psychological distress were documented in several studies.
Lack of community-based alternatives drives overuse of remand
The overreliance on custodial remand is often a default response to social problems, rather than to criminal risk. “Women are often remanded because of systemic failures in housing, mental health provision, and trauma-informed bail support—not because they pose a threat to public safety.” Community-based alternatives might solve this and avoid the disruption that remand brings.
Racial disparities and inequities
There are ethnic disparities in remand decisions: it is used more for Black women than for white women. Remand seems to sometimes be used for immigration control, disproportionately targeting foreign nationals, and foreign national women frequently receive more punitive bail decisions.
Exclusion from core services
Remanded women are routinely excluded from key support services, including resettlement, mental health care, housing, and Mother and Baby Units. There was an appalling incident when a pregnant woman on remand gave birth completely alone, was offered no support despite requesting it, and the baby died.
Family separation and child welfare harms
Remand often results in sudden and traumatic separation from children, and criminal courts rarely assess the effect of remand on child welfare. We read of cases where mothers were remanded without time to arrange childcare, leading to informal, unstable care arrangements and housing barriers for extended family.
___
All the points above are discussed further in the full report, and the sources detailed there. Appendices to the report are here.
* For explanation of using an interactive EGM like this, see here & scroll down a bit, though the software changed a little in between, sigh.
___________________
Relevant, rather shocking facts: – 85% of women on remand have been charged with a non-violent crime – As of December 2023, 22% of women in prison in the UK were on remand. – Remand is increasing being used for women – 25% between December 2022 and December 2023. – Remand – and the associated uncertainty – is particularly bad for women, with self-harm being worse amongst women on remand than other women in prison: There were 467 incidents of self-harm for every 100 women on remand compared with an overall rate of self-harm amongst women in prison of 370 per 100.
Power in philanthropy has traditionally been held – almost exclusively – by those with the money. There are calls to change that, and mercifully many initiatives and examples of it happening. Giving Evidence’s Director Caroline Fiennes was asked to speak at an event about this, and categorised some of them. Do send other examples / initiatives, and categories!
Type of shift
Example / initiative
Determining priorities for the whole fnd
David Sainsbury / Gatsby setting up (endowing) independent fnds in East Africa
Determining who gets funded
Participatory grant-making, e.g., EDGE Fund
Enabling the intended beneficiaries (the individuals) to decide what the money is spent on[1]
Cash transfers
Enabling the intended beneficiaries (individuals / community) to determine priorities
– Reverse call for proposals recently issued in Zambia. Communities decided what they wanted, put out a shopping list and asked NGOs to bid for what they could do. Then the communities decide which NGOs will do the work.[2] – Taxation[3]
Enabling the grantee to decide what the money is spent on, incl. responding rapidly to changing needs
Unrestricted funding
Increasing the accountability of funders
– Foundation Practice Rating – Global Giving UK which has an AGM open to anybody
Increasing transparency of what funders are funding
360 Giving
Incentivising (some) funders to behave less like medieval royalty
– Open & Trusting Philanthropy – Modern Grantmaking?
Encouraging / enabling funders to (opt to) listen to grantees & prospective grantees
Grantee Perception Reports Grant Advisor
Some other examples are suggested here, and not yet categorised.
[1] Note that cash transfers to individuals are great for empowerment around household expenditure etc. They are obviously unlikely to produce new / improved shared infrastructure such as roads or schools.
[3] Caitlin Tulloch suggested this, saying “only joking a little bit”. It’s a fair point: taxation in a functioning democracy is supposed to be precisely like this.
Is your foundation any good? I don’t mean: is it big, or does it give away a lot, or does it run an efficient process, or do the grantees achieve much. Rather, I mean: are you any good at being a foundation? Are you effective? Are you good at finding work that will succeed? Do your grantees think that you help them? Is progress towards your goals faster with your foundation’s involvement than it would be without you?
Few foundations seem to know. We suspect that few foundations analyze to answer these vital questions. Certainly, few publish any. Yet it is perfectly possible to find out, and to identify where and how to improve. Giving Evidence knows this because we have looked at what foundations publish about their own effectiveness, and we have done these kinds of analyses for foundations.
Our research about what foundations publish about their effectiveness
Each year, the Foundation Practice Rating assesses 100 UK-based charitable grantmaking foundations on their practices on diversity, accountability, and transparency. The research is done by Giving Evidence. For our ‘accountability’ criteria, we look at whether each foundation publishes any analysis of its effectiveness, what types of analysis it publishes, and whether it says what it will change as a result.
In this most recent year, only 16 of the 100 foundations were scored as publishing any analysis of their own effectiveness. This is remarkable given foundations’ enthusiasm for assessing other organisations, i.e. ones which they support or might support.
For the Foundation Practice Rating, we count as an analysis of a foundation’s effectiveness analysis such as:
views of grantees and/or applicants, collected systematically. (We did not count ad hoc quotes or case studies published without a statement that all grantees/applicants were surveyed, because there is no way of knowing whether the foundation has cherry-picked only the most flattering examples);
analysis of the proportion of grants which at some level succeeded vs. those which did not; or
analysis of the costs created by the foundation’s funding processes and borne by grantees/ applicants. Ideally this would be expressed as a proportion of the amount given, i.e. the net grant. This matters because clearly if a foundation is a net drain on the sector it seeks to support, then it is not helping.
None of these is a perfect measure of a foundation’s effectiveness, but each gives a line of sight. By analogy, there is no single measure of the health of a nation’s economy, which is why economists use a whole raft of measures. If a grantmaker has none of the three types of analysis listed, we would argue that it cannot know whether it is doing well.
What if the foundation does this analysis but doesn’t publish it?
That’s clearly better than nothing, though there are two weaknesses. First, the foundation is not making itself accountable about its effectiveness. And second, nobody else can learn from it.
Indeed, because only 16 of 100 foundations publish anything on this, foundations can learn only very little from each other’s public material about how to be effective and how and where to improve.
If foundations assess their effectiveness, does that shift even more power to funders and away from operating organisations?
No. Firstly, as mentioned, we count systematic surveys of grantees. That doesn’t imply anything about who is in charge, and indeed, a grantee survey would reveal whether grantees feel that power is stacked against them and show any consequent harms created by the funder. And second, we also count if a foundation reports the proportion of its grants that achieve whatever goals they are intended for. Those goals can be entirely set by the grantee.
The following are not analysis
A breakdown of where their grants went, for example, by geography or sector is not analysis of effectiveness. Rather, that simply catalogues activities or inputs.
Nor is citing activities or outputs such as “76 volunteers have received training to help them provide support within their organisations”.
Reviews of individual programmes. People can learn from those, but they do not assess the foundation as a whole.
Case studies or anecdotes of feedback from grantees are not analysis because, again, there is no way of knowing whether they are representative.
Nor do we give credit for reports recounting grantees’ achievements – because those achievements might be despite their funders! This isn’t a rhetorical joke: there are real examples of funders whose laborious processes cost grantees more than the grant is worth. In those cases, the funder is detracting from grantees’ work.
What foundations do publish on this:
Systematic surveys of grantees are the most common analysis for which FPR gave credit. Around 12 foundations publish those. Examples include that by The AB Charitable Trust.
Some surveys were run by external agencies; others appear to have been run by the foundation itself. The analysis published by the Lloyds Bank Foundation for England and Wales is structured around eight lessons that it has learned through its work, including from systematically hearing from grantees, and how it is integrating those lessons.
None of the 100 foundations assessed published analysis of the proportion of grants which meet their goals.
Near-misses and honourable mentions
Two foundations published numbers for their ‘social return on investment’ but without any detail of the calculations, input data used, or what the numbers refer to. Disclosing those details might be helpful and insightful.
Catternach cites a review of its “approach to evaluation and learning”, done by an external entity. We could not find that review published. However, the foundation does cite in its Annual Report some changes made as a result, for example adopting a lighter-touch approach to evaluation, focusing on ‘an evaluation approach that supports organisations in their own improvement process’ and generally using ‘evaluations as a tool to support grantee learning’.
Co-Op Foundation says that ‘95 percent of young people took an action after seeing our Lonely Not Alone campaign’. It cites neither any reference nor what set of young people it refers to, nor whether this number relates to the funding provided: without that, we do not know whether that number is unchanged from before the campaign – or even whether it has fallen!
Other examples come with no analysis of why the foundations have been able to achieve the claimed results, what the necessary conditions or resources are, nor the cost. So the scope for other foundations to learn from them is pretty limited.
One of the strangest statements of ‘impact’ that we’ve seen for a while is this, from the Hunter Foundation: ‘It is almost satirical that despite years of [our] investment in enterprise education and entrepreneurship, Scotland, thanks to our own Centre’s research, has not moved one jot in becoming more entrepreneurial in the past decade. We only console ourselves that the millions of pounds we’ve invested in enterprise education alongside Government and others maybe stemmed a possible reduction in entrepreneurial activity rather than just helping to maintain the status quo.’
How foundations can assess their effectiveness
The three methods listed above are all perfectly possible. In order, those are:
Systematic collection of feedback from grantees, covering all grantees. Above are examples of that, and clearly it is what the Grantee Perception Reports have gathered for years.
Analysis of the proportion of grants which (at some level) succeeded vs. those which did not. The Shell Foundation did this in a report to mark its first 10 years. Giving Evidence has done this analysis for the ADM Capital Foundation, based in Hong Kong. Another UK-based foundation did this analysis – and compared the eventual success of work that it funded to that of work that it rejected… and actually found no difference at all (!)
Analysis of the costs created by the foundation’s funding processes and borne by grantees / applicants. This is the simplest of the three to do. Giving Evidence knows of a UK-based foundation which has done it but never published it.
“Learn as if you were to live forever” – Gandhi
All foundations could usefully do these analyses, in order to learn where and how to improve. We are happy to discuss with any foundation how to do this.
The actual diversity hasn’t changed much since last year – but that’s hardly surprising as it’s only one year
The number of UK foundations reporting data about the diversity of their staff and boards seems to be growing. These data are from the Foundation Practice Rating which, each year, selects 100 UK grant-making foundations to research, and it publishes a rating of each one. (The method and results are here.) In FPR’s Year Two (2022-23), only nine of the 100 foundations which were researched had disclosed data on the diversity of their staff and/or trustees: in this most recent Year Three (2023-34), that has doubled to 18.
Obviously that is an improvement, but it is also fewer than a fifth of the foundations researched, so there is much more for foundations to do on this.
Why we publish this
The Foundation Practice Rating assesses foundations’ practices in three domains: diversity, accountability and transparency. Its goal is to improve practices, and it is funded by a group of foundations. FPR uses only publicly-available information. In diversity, FPR looks at whether foundations disclose the diversity of their staff and, separately, their trustees, on various dimensions: FPR (currently) does not currently look at what that diversity is. FPR has no opinion on whether any foundation’s diversity is ‘enough’ or what it should be. We simply note what it reports. The research for FPR is conducted by Giving Evidence. Nonetheless, during the FPR research, the FPR team notes which of those 100 foundations make those disclosures. It is only a small step to then log and collate their actual data on what the diversity is, and so – despite this being outside FPR’s scope – Giving Evidence has done this. To our knowledge, these are the sole data about diversity of UK foundations to be published, so Giving Evidence is sharing them here in the hope that they are useful. This is the second year that we have reported these figures, i.e., the first time for which there is any kind of time-series from which to see whether and how the diversity of UK foundations’ teams is changing.
Our method
FPR draws a fresh sample of foundations each year. Some foundations are included each year (the foundations funding this project plus any which are amongst the UK’s five largest year-to-year) and others are drawn at random. This is so that no foundation is ‘off the hook’: this matters because FPR is a behaviour change project rather than a research exercise. Therefore, some foundations may be included one year but not the next. We report here on the diversity disclosures of the 100 foundations researched in Year Two and the 100 foundations researched in Year Three, although those are not the same set. We have used the same dimensions of diversity in Year Three as we did in Year Two: gender, race, sexual orientation and disability. We have also used the same approach, which is to (a) use the categories which the foundations report and (b) to avoid illegibly-complicated graphs, we report the % of personnel which the foundation reports as identifying as outside the dominant category (e.g., White). This approach is discussed here, and we remain aware of the limitations.
Foundations in the Year Three cohort (2023-24) which disclose the diversity of their personnel:
11 foundations in total. In Year Two, this was six.
18 foundations in total. In Year Two, this was five.
*These foundations are among those which fund the Foundation Practice Rating.
How many foundations report about the various dimensions of diversity?
Increasingly many, on every aspect, though still few given that FPR researches 100 foundations each year.
No. foundations included in FPR reporting on the following aspects of diversity of their teams:
Did any foundations start or cease reporting their diversity?
Yes. If we look at foundations researched in both Year Two and Year Three, we find that:
One foundation which reported the diversity of its staff in Year Two did not do so in Year Three: that is Garfield Weston Foundation.
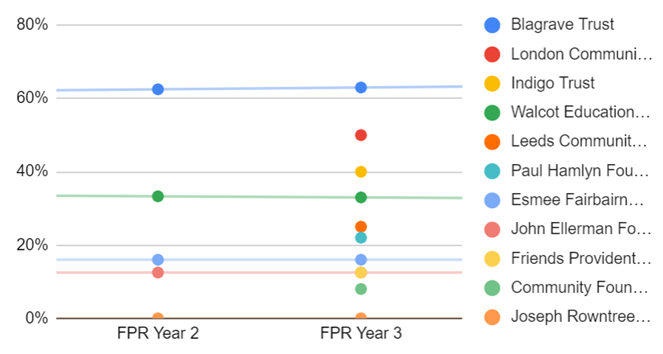
Several foundations started to report the diversity of their teams. For example, Indigo Trust and Friends Provident Foundation both started to report on diversity of both their staff and trustees. John Ellerman Foundation and Blagrave Trust reported only on diversity of their trustees in Year Two but in Year Three were reporting also on diversity of their staff.
How has the reported diversity changed?
Let’s start with the foundations which reported their diversity both in Year Two and Year Three. Their diversity hasn’t changed a whole lot during the year. That’s not surprising: the turnover of foundation staff and trustees is typically pretty low – they’re nice jobs!
Many foundations have fairly few trustees, so even if the reported proportions of their composition had changed, we would need caution because that might reflect only very few trustees joining, leaving, or changing their declarations.
What about the foundations which reported for Year Three but not in Year Two? We need to be mindful that there are two groups of those: first, foundations which were included in Year Two but didn’t report about diversity then though did by Year Three; and also foundations which weren’t included in Year Two. Let’s call the two groups ‘newly-reporting foundations’.
On trustees, no ‘newly-reporting foundation’ reported in Year Three greater diversity than the foundation which reported the greatest diversity in Year Two. For example, on ethnicity, the foundation which in Year Two reported the greatest proportion of trustees who declared themselves something other than White was Blagrave Trust, at 63%. Blagrave Trust’s figure for that was unchanged in Year Three. All the Year Three figures for the ‘newly-reporting foundations’ on that dimension were lower than that for Blagrave Trust:
Trustee diversity, % declaring other than “white” categories:
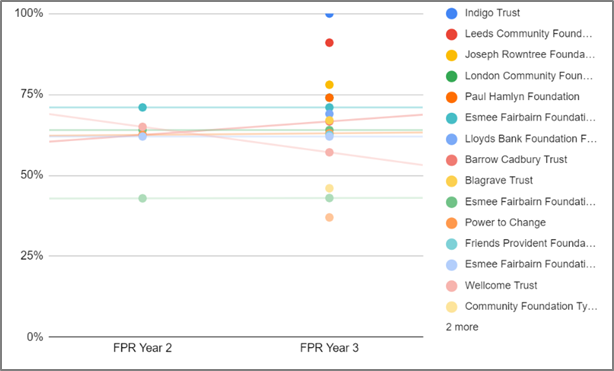
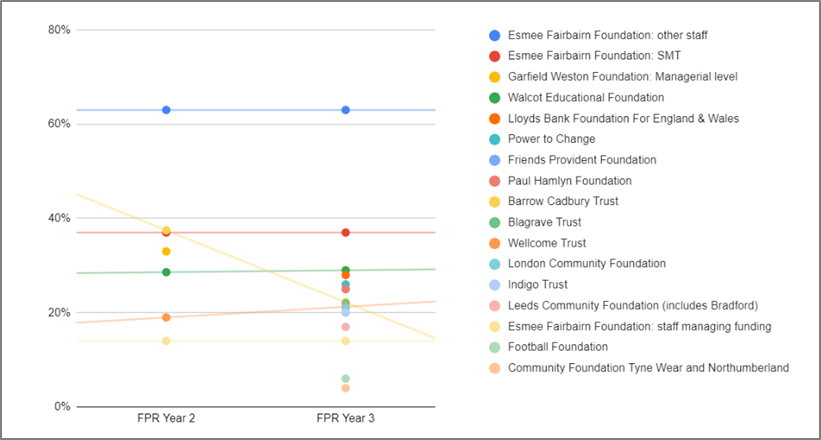
On staff, the story is quite different: some of the ‘newly-reporting foundations’ reported in Year Three greater diversity than the foundation which reported the greatest diversity in Year Two. For example, on ethnicity, the foundation which in Year Two reported the greatest proportion of staff who declared themselves something other than White was Esmee Fairbairn Foundation, at 23%. Again, its figure for that was unchanged in Year Three. But in Year Three, Friends Provident started reporting on this, and reported 38% (see graph below). Similarly, on staff gender, the foundation which in Year Two reported the greatest proportion of staff who declared themselves something other than male was again Esmee Fairbairn Foundation, at 71%, which was again unchanged in Year Three. But in Year Three, Indigo Trust started reporting on this, and reported 100%. Three other ‘newly-reporting foundations’ also reported figures higher than 71%.
Staff diversity, % declaring other than “male” categories:
There also examples of the converse: where newly-reporting foundations report in Year Three having fewer staff outside the dominant category than did the lowest-reported foundation did in Year Two. Staff ethnicity is an example:
Staff diversity, % declaring other than “White” categories:
These numbers don’t indicate whether diversity of either trustees or staff have changed, because we don’t have the data for these foundations for Year Two. Rather, they simply indicate that more foundations are reporting, and that some of the foundations new to doing so have more staff outside the dominant categorisation than do the foundations which reported in Year Two. Giving Evidence will continue to track these data and assess the changes over time.
The levels of diversity reported
Within the foundations which report diversity on these dimensions, there is a range of levels of diversity.
The largest range is for: staff gender, and trustee ethnicity. In both cases, the difference between the highest proportion and lowest is 63 percentage points.
The smallest range is for: trustee sexual orientation, where the difference between the highest proportion and lowest is 22 percentage points.
Range of proportions of personnel who declare identifying as:
Trustees
Staff
Ethnicity: % declaring other than “White” categories
0 – 63%
4 – 63%
Disability: % declaring disability (sometimes including limiting health conditions)
0 – 50%
0 – 38%
Sexual orientation: % declaring orientation other than straight
0 – 22%
8 – 44%
Gender: % declaring other than “male”
40 – 67%
37 – 100%
Some key findings
For three of the four categories measured – ethnicity, disability and sexual orientation – some foundations reported having no trustees who identify outside the dominant category.
On disability, 17% of the UK population is disabled (Census, 2023). Only four foundations reported that, of their staff, more than that proportion identify as having a disability, whereas eight reported fewer. The picture for trustees was more balanced: six reported a proportion lower than 17% whereas four reported having more.
Giving Evidence will continue to monitor and report about the amount of disclosure by foundations, and the level of diversity reported.
A new project will collate the measures used in studies of institutional responses to child abuse and show how both researchers and practitioners can use these measures, and the measures’ respective strengths and limitations. Article by Gabrielle Hunt.
A newly updated Evidence and Gap Map (EGM) collated rigorous ‘what works’ studies about institutional responses to child maltreatment: incl. preventing it and responding to it. Although the body of evidence is growing, there are still significant gaps.
The EGM includes randomised controlled trials, quasi-experimental design studies, and systematic reviews. Most studies on it examined interventions that aimed to raise children’s knowledge (e.g., about how to avoid being abused or how to report abuse) or include measures to assess improvements in their well-being. Though this is important for a well-rounded approach to prevention, it places much of the responsibility for safety on children rather than on the adults who care for them. Few studies directly measure the incidence of maltreatment, and only a few studies measured the attitudes or skills of adults working with children or the culture in institutions.
It is essential to determine whether the measures used in the studies actually measure children’s safety or incidence of abuse, and which measures are most useful for research and practice.
Professor Daryl Higgins and Gabrielle Hunt from the Institute of Child Protection Studies (ICPS) at Australian Catholic University will work on a 3-month project to collate details about all the outcome measures used in the studies on this EGM. ICPS is a nationally recognised centre for excellence in child, youth, and family welfare and is committed to collaborative approaches to translating knowledge into policy and practice. Professor Daryl Higgins has researched child abuse impacts and prevention, family violence, and family functioning for nearly 30 years. He has focused on public health approaches to protecting children and child-safe organisational strategies. Gabrielle’s PhD studies, which aim to understand the prevalence and prevention of child sexual abuse in faith-based settings, as well as understanding harmful sexual behaviour and peer sexual harassment across the population, are being supervised by Daryl.
This project aims to understand how to apply these measures effectively and identify their strengths and limitations (psychometric properties). Our initial review has revealed inconsistencies in how surveys, questionnaires, or tools to measure ‘safety’ are applied in organisations. Many studies focus on ‘proxy’ measures, such as children’s knowledge, but these measures may not accurately predict better safety. We also plan to explore other tools that have yet to be used in causal or experimental research that may be useful to youth-serving organisations.
We hope that by exploring the studies on the EGM, we can provide new insights into the usefulness of the measures used. We would be delighted to hear from other researchers who have done work to mine data in an EGM or other similar reviews to share their insights and experience. We plan to publish a resource outlining our findings and identify measures that leaders, practitioners, researchers, and funders can use in their work.
If you have conducted a similar study, or would like to hear more, please get in touch.
The Foundation Practice Rating rates 100 UK charitable grant-making foundations each year on their practices on diversity, accountability and transparency. The set of foundations which we research and rate changes from each year. A couple of people have asked recently why we do that and whether that compromises the FPR’s rigour. This article is to explain.
Our sample
To be clear, the set of 100 ‘included foundations’, as we call them, each year is as follows[1]:
The five largest charitable grant-making foundations by giving budget.
All the foundations which fund the Foundation Practice Rating. (There are currently 13 of them. One is not a charity: the Joseph Rowntree Reform Trust.)
A random sample of: community foundations across the UK (as listed by UK Community Foundations, the membership body of community foundations), and the ~300 largest foundations in the UK (as listed in the ACF’s annual Foundations Giving Trends report).
The sample is organised so that it is stratified, i.e., a fifth is from the top quintile in terms of giving budget, a fifth from the second quintile etc. So, for example, if no foundation funding the FPR is in the 2nd quintile, then all 20 included foundations in that quintile would be chosen randomly; whereas if three foundations funding the FPR are in the 2nd quintile, then 17 foundations in that quintile are chosen randomly. Obviously, at least five ‘slots’ in the top quintile are filled non-randomly (by the five largest foundations), and some other ‘slots’ are filled by foundations funding the FPR, so in the top quintile, not all the ‘slots’ are filled randomly. The foundations funding the FPR vary considerably in size: they are not all at the top.
We re-make the sample each year. The FPR is not a panel study: we do not track the same participants over time. This is intentional.
Notice that our sample is 100 out of about 340 foundations*. Thus we include ~29% of the total set. (*Those are: the ~300 on the list in the ACF report, + about 35 community foundations, + a couple of foundations which fund FPR which are in neither of those.)
Why do we change the sample each year?
Well, on the first part of our sample, the five largest foundations change around: in the three years that we have been doing this, eight foundations have appeared in the largest five at some point. Looking at the chart below, it would seem rather bizarre to continue to rate, say, BBC Children in Need – now the 11th largest foundation – just because it was in the largest five when the FPR happened to start. We always include the (then) five largest foundations because their practices dominate grant-seekers’ experiences, so it is important to reflect which foundations those large ones are at the time.
On the second part of our sample, the set of foundations funding FPR changes: in the first year, there were only 10 and now there are 13.
On the third part of our sample, the rationale is this. First, we are trying to get a representative picture of progress across the whole foundation sector. And second, part of the ‘intervention’ of FPR is foundations knowing that they might be included at any time. If some foundations knew that they would definitely be included, they would have an incentive to improve their practices in order to improve their grades, but other foundations would not feel that incentive so might not improve, or at least, not make so much effort to improve. Thus the random selection enables FPR to have more influence than if it were a panel study: and our primary goal is to influence practice.
These two reasons interact. If FPR were a panel study, quite probably the foundations included would improve more than those who are not, and we would gain zero information about the set which are not included. They might well diverge over time. We therefore would not get a sense of the sector as a whole.
Given that the sample changes, how can FPR make year-on-year comparisons?
The technique of studying a randomly-selected subset of relevant entities is used in many surveys of public opinion, including consumer confidence and voting intention. Typically, those survey 1000 randomly-chosen adults from across the country. The sample may be adjusted to make it representative e.g., in terms of age, gender, the four nations of the UK. That is like FPR ensuring that our sample is representative in terms of foundations’ size. So, when you see news stories that voting intention has changed, those are almost certainly based on sequential studies of a small set of people, and that set is freshly-drawn each time.
Professor Stephen Fisher of Oxford University studies public opinion and was on the British Polling Council panel that investigated the 2015 UK General Election polls. He says:
“The methods that FPR uses are very sensible. Dividing foundations into five groups according to how large those foundations are, and then randomly selecting foundations within each group should ensure a broad and representative sample overall. Opinion polls aren’t perfect, but they typically get the share of the vote within a margin of error of +/- 4 percentage points. They come from sampling around 1 in every 30,000 voters. FPR is sampling 1 about in every 3.5 foundations: a much larger proportion of the total, and with much more coverage of the bigger foundations. On that basis, fluctuations in the FPR due to random differences in sampling should be very small indeed.”
Making year-on-year comparisons
On the basis described above, it is rigorous to compare the full set of 100 foundations year-on-year. We made that comparison in the Year Two report – i.e., the first year when we had a previous year. In that report, we also included comparison of:
The set of foundations which were included in both years
The set of foundations which were randomly included in Year One with the set of foundations which were randomly included in Year Two.
In each case, we assessed the changes in overall numerical scores and numerical scores on each of the three domains (diversity, accountability and transparency), and we looked at whether those changes were statistically significant.
We will repeat and extend those analyses in subsequent years.
The FPR Year One (2021/22) and Year Two (2022/23) reports are here.
[1] Foundations can opt-in to the FPR: they can pay to be assessed. They are treated as follows. If a foundation wants to opt-in and happens to be selected randomly for inclusion, then it is treated as a normal randomly-included foundation: it does not pay and its results are included in the analysis of the main 100. By contrast, if a foundation wants to opt-in and is not selected randomly for inclusion, then it pays and is not included in the analysis of the main 100. This is to avoid selection bias in the sample.